NVDA Surges, Feedback Loops, FOMC Minutes
Leading Economic Indicator Negative 22 Months Straight
The AI Bubble
Nvidia, known as one of the "Magnificent 7" set of global tech stocks, forecasted a roughly 233% surge in quarterly revenue. This forecast sent its shares up by approximately 10% in pre-open Wall Street trading. However, it's worth noting that Nvidia's shares initially dropped before reversing after the earnings report was released. This forecast exceeded expectations and could potentially add more than $200 billion to the company's market capitalization. The positive performance of Nvidia also had a ripple effect on other companies seen as beneficiaries of the AI boost, including its rival Advanced Micro Devices (AMD) and server component supplier Super Micro Computer (SMCI).
Market Feedback Loop
Wall Street analysts also play a crucial role in shaping the market trends. When prices on stocks rapidly rise, industry analysts tend to raise their estimates for the revenues, earnings, and profit margins of their companies. This, in turn, leads to a justification of these estimate increases by convincing themselves and clients that fundamentals have vastly improved. This cycle can fuel a rapid rise in stock prices, also known as a market meltup, which is typically followed by meltdowns.
The president of Yardeni Research and his team have been analyzing data showing industry analysts' consensus expected long-term earnings growth (LTEG) for S&P 500 companies. This reflects analysts' annualized expected earnings growth over the next three to five years. The data suggests that industry analysts tend to be overly bullish on the long-term earnings prospects of the companies they follow.
The MegaCap 8 stocks - Alphabet, Amazon, Apple, Meta, Microsoft, Netflix, Nvidia, and Tesla - which make up 32.2% of the S&P 500's market capitalization, have seen their LTEG increase significantly. This carries weight in the index overall and could potentially influence market trends.
Leading Economic Index
the Conference Board's Leading Economic Index (LEI) is a key tool for assessing the overall health of the economy. The LEI is a composite index of ten economic indicators that typically lead overall GDP growth. It can provide early signals of turning points in the economy such as peaks and troughs.
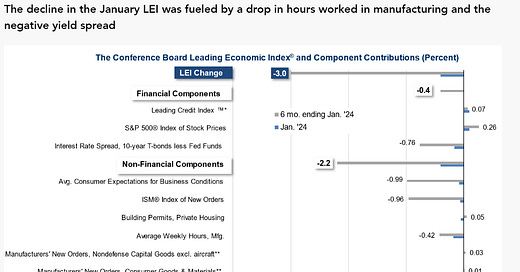
The Leading Economic Index (LEI), a key indicator of economic health, fell by 0.4% in January 2024, marking its 22nd consecutive month of decline. Despite this, six of the ten index components have shown positive results over the past six months. This is the first time this has happened in two years, suggesting that the economy may not be heading towards a recession. Source
When the LEI is broken down into its component parts, each major component is still negative. Additionally, the positive components exhibit only a slight increase compared to the negative ones, which may indicate a potential shift towards improvement or merely a return to the average within an overall downtrend.
FOMC Minutes
The minutes from the Federal Reserve's last meeting highlight the uncertainty associated with how long a restrictive monetary policy stance would need to be maintained to return inflation to the Fed's 2% target. Most participants noted the risks of moving too quickly to ease the stance of policy, while a few pointed to downside risks to the economy associated with maintaining an overly restrictive stance for too long. Policymakers agreed they needed "greater confidence" in falling inflation before considering cutting rates.
Markets have significantly dialed back expectations for early and rapid rate cuts as a result, with traders in the federal funds futures market now betting the Fed will first lower rates in June. Investors also expect three to four cuts in 2024, a pace more in line with policymakers' median projection in December.
Some noteworthy notes from the minutes:
The system's financial vulnerabilities were described as notable, with asset valuation pressures considered significant. Valuations in various markets were deemed high relative to fundamental values.
House prices were at the higher end of their historical spectrum when compared to rents and Treasury yields, despite restrictive underwriting standards.
Commercial real estate (CRE) prices, particularly in multifamily and office sectors, were on the decline, reflecting weaker fundamentals, especially evident in the office sector due to low transaction levels.
Leverage within the financial sector, especially in banking, was noted as significant. Banks showed robust regulatory risk-based capital ratios, indicating strong loss-bearing capacity. Insurers were increasing their investments in higher-risk corporate debt.
As well, in the Fed’s eye the U.S. Labor market has continued to expand at a brisk pace, adding 353,000 nonfarm payroll positions in January. This, along with a GDP growth at a 3.5% annualized pace in 2023 and Gross Domestic Income (GDI) growth of 1.5%, has encouraged FOMC members that the succession of 11 interest rate hikes implemented in 2022 and 2023 have not substantially hampered growth.
Members also brought up the bond holdings on the Fed's balance sheet. The Fed has allowed $1.3 trillion in Treasurys and mortgage-backed securities to roll off rather than reinvesting proceeds as usual, aka quantitative tightening. The central bank's balance sheet, which at one point reached almost $9 trillion, has been a topic of discussion among financial experts. The balance sheet has shrunk by $3 trillion since the Quantitative Tightening (QT) started in June 2022.
Fed officials consider current policy to be restrictive, so the big question going forward will be how much it will need to be relaxed both to support growth and control inflation.
Thanks For Reading!
To Read Past Newsletters Click here.
If you have any source you wish to see in our lineup, please reach out and let us know. We continually look to incorporate more independent sources to our weekly wrap-up.


