The Real Story Behind Employment
Full Time Jobs Down. Native Born Workers No Net Gains In Jobs.
Base Jobs #’s Being Reported On
The US economy added far more jobs than expected in May as nonfarm payrolls expanded by 272,000 for the month, up from 165,000 in April and well ahead of the Dow Jones consensus. The unemployment rate rose to 4%, the first time it has reached this level since January 2022. This increase was due to a decrease in the number of people holding jobs by 408,000 as reported by the household survey used to calculate the unemployment rate. Additionally, the survey revealed a decline in full-time workers by 625,000, while part-time positions increased by 286,000. Revisions brought jobs added in March and April down by 15,000.
The Mainstream Narrative
The strong jobs data and wage growth suggest a robust economy, which decreases the likelihood of the Federal Reserve cutting interest rates.
Chances of rate cuts for the Fed’s mid-September meeting fell from 81% to 57%.
Inflation has been slower to fall in 2024 because of our robust labor markets.
This raises a couple questions:
How is our labor market this robust when full time employment is down?
How are we getting positive jobs added reports every month?
Why are all job gains foreign based workers?
Why do we rely only on the establishment survey and not the household survey?
Full Time vs Part Time Employment
(Sources FT Emp, PT Emp)
Since June 2023 Full Time Employment is down over 1.5 million jobs. How is this job market robust if we are actively taking away full time jobs and replacing them with part time jobs? It is logical to assume that many of the price increases in inflation has not been due strictly to wages. So why does the Federal Reserve then tie themselves so directly to employment as a measure of who the economy is doing?
What is driving positive job reports
The BLS uses something called Birth/Death Assumptions, which account for the formation of new businesses. In May, the BLS assumed that 231,000 jobs were added due to these assumptions. Without Birth/Death assumptions, the number of jobs added for this year drops to -557,000, as Birth/Death assumptions account for +603,000. So the assumption is that so many new businesses are forming that our economy is adding jobs.
Foreign vs Native Born Employment
Source (Foreign vs Native)
When we look at this chart two thing are obvious. Native born workers have almost no job growth since 2018. Foreign born workers have consistently taken a larger share of the job market. In May, 663k native-born Americans lost their job while 414,000 immigrants (legal and illegal) gained a job.
So why would foreign born workers employment be rising?
Simple “In 2023, median usual weekly earnings of foreign-born full-time wage and salary workers ($987) were 86.6 percent of the earnings of their native-born counterparts ($1,140)”
(Source BLS)
The employment segment experiencing growth comprises individuals who can be paid below market rates. Undocumented workers are particularly vulnerable to exploitation by businesses. Additionally, legally present foreign workers face the risk of losing their visa status if they lose their job, and they often lack strong familial support networks already in the US.
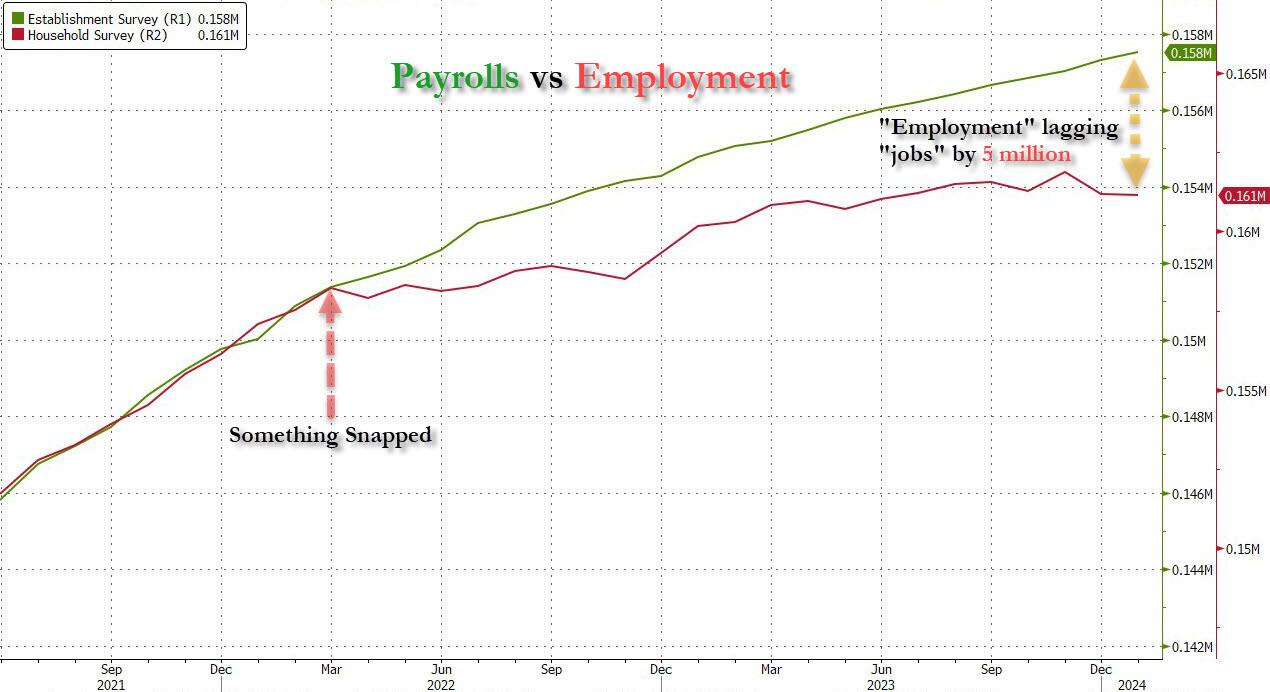
Establishment vs Household Survey
The Household Survey counts the number of employed individuals, including the self-employed and those with multiple jobs, while the Establishment Survey measures the number of jobs in the economy, counting each job separately even if held by the same person. The Household Survey is the lesser-used measure, although the unemployment rate comes from this survey.
In May, the disparity between the headline jobs number from the establishment survey and the household survey reached 4.1 million, marking the largest difference in history. Over the past 6 months 1 million Americans have become unemployed. Additionally, the number of people working multiple jobs in the U.S. nearly hit a record high of 8.4 million in May 2024.
(Source)
Also worth noting:
The BLS is reducing the sample size of the Household Survey due to “budget constraints”. As a government, we run a 380 billion deficit monthly and somehow cannot afford to run this survey effectively? Highly Suspect. Seems these numbers are not favored, so lets slash the funding to fix the numbers. To silence opposing narrative.
Wrapping Up:
While the job numbers on the surface look strong, there's a lot more going on underneath. The rise in the unemployment rate and the loss of full-time jobs point to some real problems in the labor market, even as part-time work increases. The big gap between the establishment and household surveys also makes us question the accuracy of the job gains we're seeing. The segment of workers adding jobs are foreign-born workers taking jobs at lower wages. Plus, cutting the household survey's sample size due to "budget constraints" seems suspicious and makes it harder to trust these figures. As the Federal Reserve bases its decisions on these numbers, it's important to dig deeper to get the real picture of our economy.
Thanks For Reading!
To Read Past Newsletters Click here.
If you have any source you wish to see in our lineup, please reach out and let us know. We continually look to incorporate more independent sources to our weekly wrap-up.


