

Anthropic's market debut was supposed to reignite the AI trade. It did the opposite. The listing followed a record $120bn raise (FT).
The stock listed at $83, popped 17% on Thursday, then slid 9.1% on Friday to $88.30 after coming within a nickel of its offering price (WSJ). Over the week, members of the Nasdaq composite shed more than $4 trillion in market value (WSJ).
The Nasdaq 100 lost 10.4% for the week, its worst stretch since the Covid shock (FT). It now sits 20% below its October 6 intraday high, the usual bear market line (FT).
The S&P 500 dropped 3.7% Friday to 6910.39 and the Dow fell 949.73 points to 48147.33, putting both in correction territory (WSJ). The Nasdaq composite is now down more than 2% for 2026 (WSJ). The headline is AI. The real story is in what investors ran to.
What Held Up Tells You More Than What Broke
If this were only a tech blowup, money would rotate into other risk assets. It didn't. Wolf Richter notes that gold and silver fell alongside stocks, as did crypto, leaving Treasuries the lone winner (Wolf Street):
Gold: down 4.0% Friday to $3,539 an ounce
Silver: down 7.4% Friday to $41.08
Bitcoin: down 14% on the week to $58,761
But the damage under the surface was uneven. Real Investment Advice points out the equal-weight S&P 500 fell 6.1% for the week versus 8.4% for the cap-weighted index. By RIA's figures, staples and utilities lost just 2.0% and 3.0%, while the long-Treasury ETF (TLT) gained 2.6% (RIA).
Wolfe Research's Chris Senyek sees staples, healthcare and real estate leading as investors hunt for cover. Barron's adds that the equal-weight S&P ETF is up nearly 12% this year, roughly double the standard index (Barron's). Even a retailer like Target rose 2.7% on the week (IBD). The lesson: diversification didn't dodge the hit, but it softened it.
The Bond Market Is Saying Two Things at Once
The 10-year yield fell 0.14 point Friday to 4.909% at settlement. The 2-year dropped 0.26 point on the week to 4.611%, its biggest weekly decline since 2024 (WSJ). That is a classic haven bid.
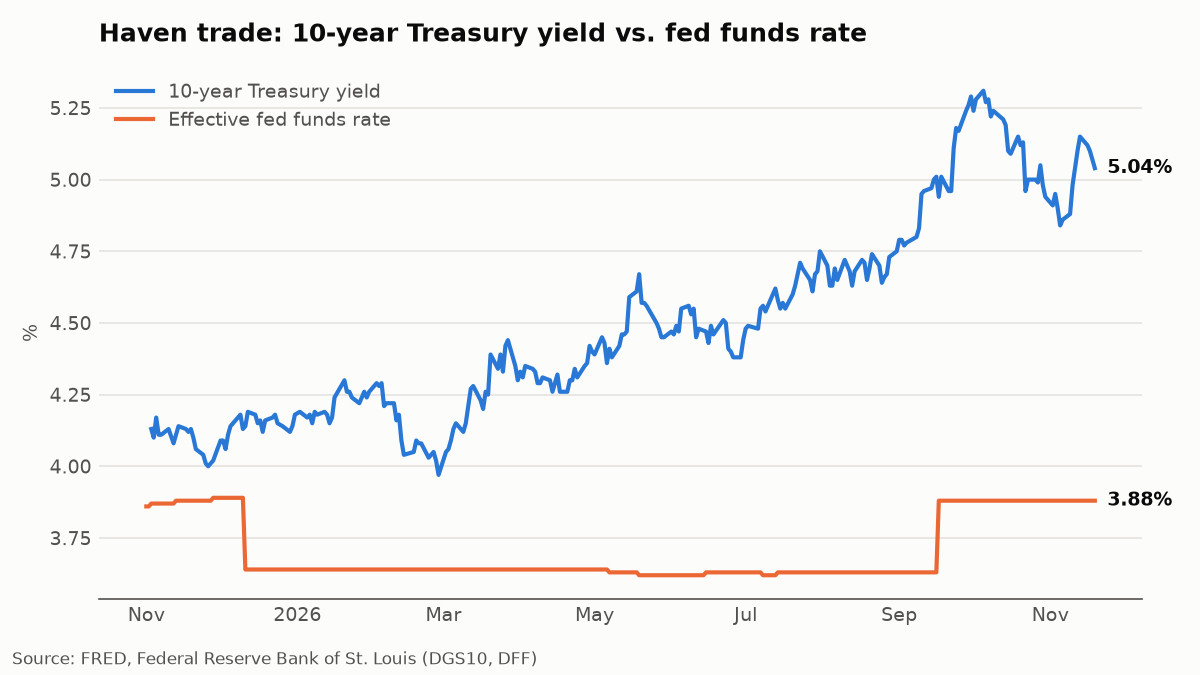
The 10-year yield climbed from 4.84 on November 5 to 5.15 on November 13, then eased to 5.04 by November 19. The effective fed funds rate, meanwhile, held at 3.88 from November 8 through November 12.
So how can bonds rally if inflation is running hot? Richter argues they shouldn't, pointing to CPI at 4.0% and producer prices up 6.5%. Richter also notes the very short end of the curve rose as traders locked in a quarter-point December hike (Wolf Street). In Richter's view fear overrode fundamentals, and the rally faded by mid-afternoon Friday.
The Fed is only muddying the water. Governor Christopher Waller argued the Fed should lift rates by 50 basis points when it gathers December 8-9, pointing to core CPI's third consecutive 0.3% monthly gain (RIA). Yet futures traders are no longer fully pricing even a quarter-point move (FT). RIA's read: bonds are beginning to worry about growth even as the Fed keeps its sights on inflation.
The 200-Day Line Broke. The Data Hasn't, Yet.
The S&P closed 6.0% under its 200-day moving average, which stands at 7,348.58 (the average close over roughly the past ten months). Its 14-day RSI, a momentum gauge, hit 24.7, the lowest since April 8, 2025 (RIA).
Underneath, the economy still looks sturdy. RIA cites third-quarter earnings growth of 31.9%, with fourth-quarter estimates raised 1.1% since September 30. RIA also points to GDPNow tracking 3.4% growth and jobless claims at 203,000. The cracks are at the edges: the Philadelphia Fed index sank to 6.3 against expectations of 20, and existing home sales are at their slowest pace since 2010.
The next test arrives fast. The Fed's preferred inflation gauge, PCE, lands next week (WSJ). RIA's tell to watch: if Treasuries start falling with stocks, the selloff has entered a more dangerous phase.
Opposing Views
The Bull Case
RIA calls this a liquidity event, not an earnings recession. Since 1950 the S&P has suffered 17 five-session drops of 8% or more, by RIA's count. In 15 of those cases, RIA finds, it stood higher three months on, by a median 8.1%, though the median additional slide en route was 4.5% (RIA).
Richter expects fear to exhaust itself and a bounce to follow, noting chip stocks rose after hours (Wolf Street). Even in a full AI bust, TS Lombard's Dario Perkins sees a mild downturn, since most data center gear is imported (Barron's).
The Bear Case
WSJ's James Mackintosh warns the AI trade is circular: falling shares could force spending cuts that hit suppliers, their lenders and eventually consumers through a reverse wealth effect. Amundi's Vincent Mortier puts it bluntly: "Generally you know you're in a bubble when it bursts" (WSJ). Perkins estimates a bust could erase $20 trillion of wealth, and Capital Economics' Neil Shearing flags a Shiller CAPE near its dot-com peak (Barron's). And with inflation elevated, the Fed may have no cushion left to offer.
Conclusion
The AI selloff is real, but the bigger signal is a bond market leaning toward a growth scare while the Fed leans toward hikes. The next few weeks will show which one blinks.
Watch next week's PCE report and Fed speakers for any softening on December hikes.
If Treasuries sell off alongside stocks, treat it as a warning, not a buying signal.
Equal-weight, staples and utilities cushioned the drop; concentration in AI leaders did the damage.
Gold and bitcoin offered no shelter this week, so don't count them as hedges by default.
Strong earnings and jobs data argue against panic, but the 200-day average is now overhead resistance.
Sources
US tech stocks plunge into bear market in worst week since Covid-19 crisis - FT, 2026-11-20
Anthropic’s IPO Bust Deepens $4 Trillion AI Wipeout on Wall Street - WSJ, 2026-11-20
Nasdaq Turns Red For The Year - WSJ, 2026-11-20
U.S. Stocks Extend Plunge as AI Boom Turns to Bust - WSJ, 2026-11-20
As Stock Selloff and “Haven Trade” Took Over the Treasury Market this Week, Fundamentals Went Out the Window (Briefly) - Wolf Street (RSS), 2026-11-22
Fear Erupts, AI Stocks Tank, but so Do Gold, Silver, Cryptos, Nearly Everything but Treasuries - Wolf Street (RSS), 2026-11-21
The 200-Day Average Broke. The Next 4 Weeks Are Critical - Real Investment Advice Ria Bull Bear Report (RSS), 2026-11-21
Has the AI Bubble Already Burst? - WSJ, 2026-11-22
If AI Boom Turns Into a Total Bust, Here’s What the Pain Could Look Like - Barron's, 2026-11-21
Target, Biotech Lead 5 Stocks Showing Strength In Brutal Market - IBD, 2026-11-21
Haven trade: 10-year Treasury yield vs. fed funds rate - Source: FRED, Federal Reserve Bank of St. Louis (DGS10, DFF)
Haven trade: 10-year Treasury yield vs. fed funds rate - Source: FRED, Federal Reserve Bank of St. Louis (DGS10, DFF)
Thanks For Reading!
If you have any source you wish to see in our lineup, please reach out and let us know.
It's been a while since our last issue. If these emails aren't for you anymore, you can unsubscribe here, no hard feelings.