

Traders cooled on both markets this week, and prices gave them reason to. Stock sentiment averaged 8.3, down 5.4 points from the prior week, while the S&P 500 fell 2.7%. Crypto mood slid further, down 12.2 points, as Bitcoin lost 1.6%.
Stocks
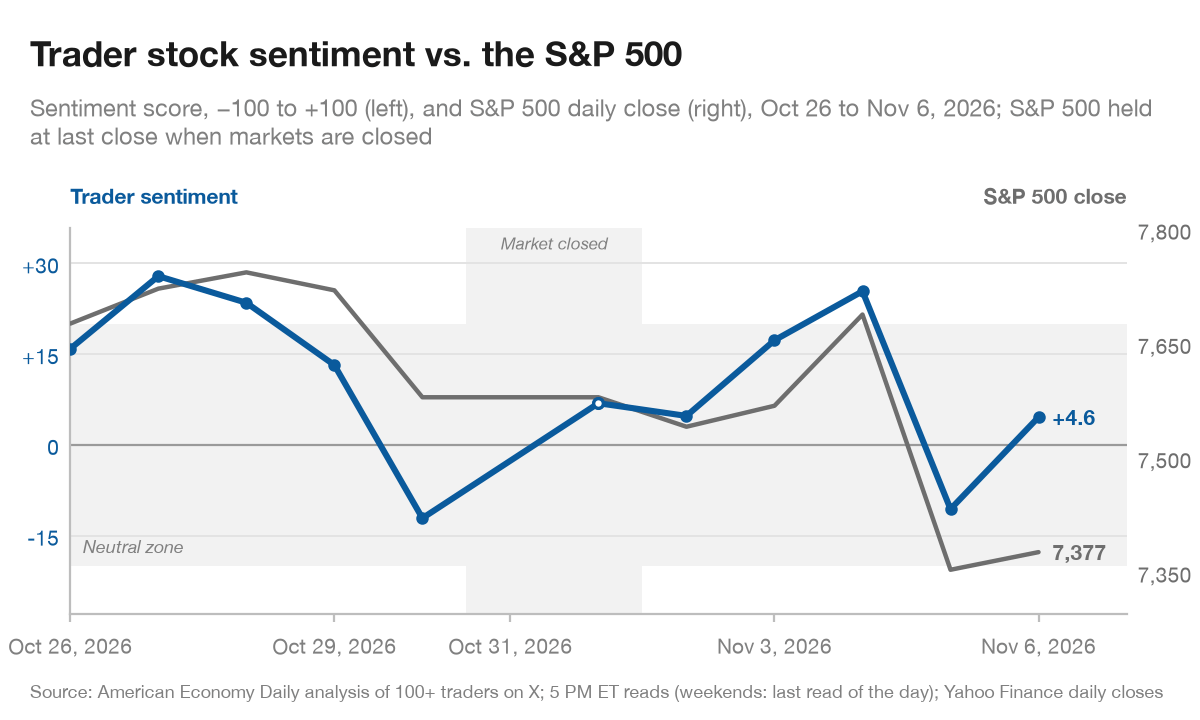
The week’s reading. Our stock reading averaged 8.3 for the week of Nov 2, 2026, which is neutral. That is down 5.4 points from the prior week’s average of 13.7. The S&P 500 closed at 7,376.86 on Nov 6, 2026, down 2.7% from 7,580.07 on Oct 30, 2026. The week before, the index slipped 0.6%.
Mood peaked at 25.4 on Nov 4, 2026. It then dropped to -10.6 on Nov 5, 2026, the same day the S&P 500 posted its lowest close of the week at 7,353.73. The latest reading is 4.6, close to Monday’s 4.8, so traders ended the week roughly where they started it.
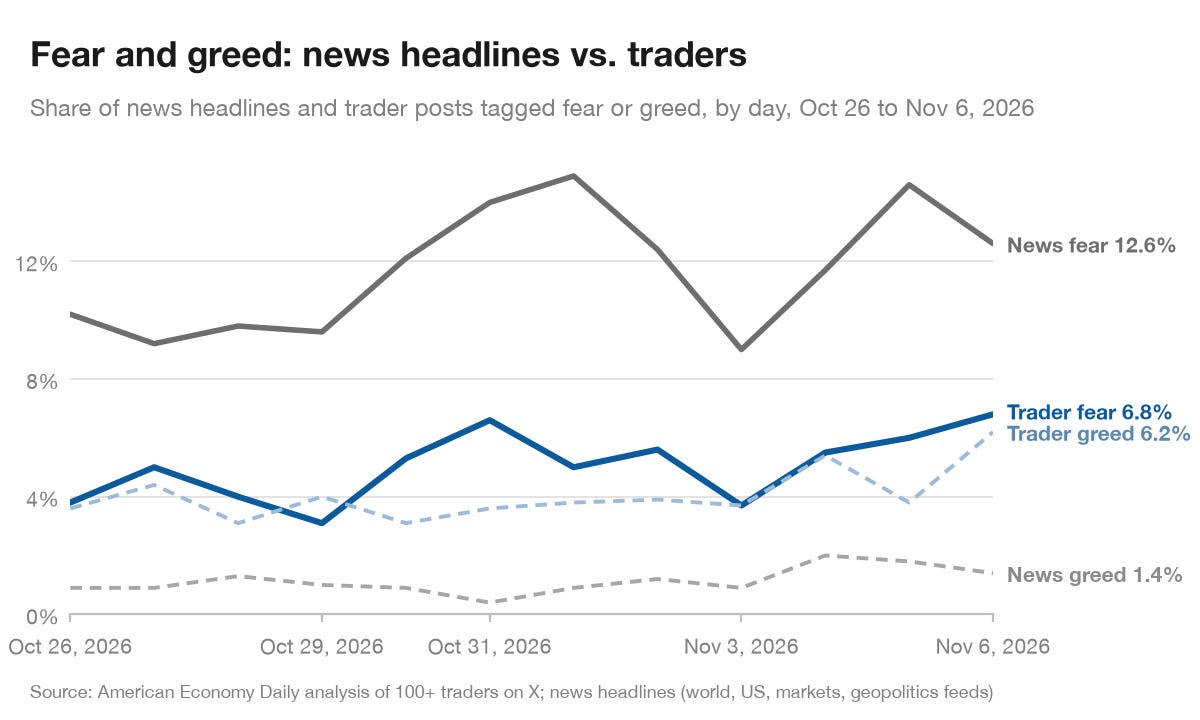
News vs. traders. The share of news headlines carrying fear rose to 11.9% from 10.1%, and greed rose to 1.5% from 1.0%. Trader posts moved the same way, with fear at 5.6% versus 4.2% and greed at 4.5% versus 3.6%. Those trader figures cover stocks and crypto together.
With fear and greed both rising, this looks like a louder week more than a clearly darker one.
Loudest bull and bear. On Nov 4, @SuperLuckeee made the case that a Democratic Congress is good news for stocks. They pointed to a one-day $SPY reversal from $748 to $768 and set a next target of $800+. Their eight reasons ranged from Brent falling under $100 to gridlock blocking policy surprises.
@SuperLuckeee also cited history: in 10 of the last 10 midterms, $SPY was higher six months and a year later. “The panic was the dip,” @SuperLuckeee wrote. They expect a Santa Claus rally. The next day’s close did not get the memo.
On Nov 5, @DMT_Doctor took the other side. They said Micron has been selling hard since it was rejected at its daily 50-day moving average, and that they have leaned short on both $MU and $QQQ since each lost that line. Their downside target is the daily 200-day average. If that level does not hold, @DMT_Doctor expects a retest of the July low, a move they say they have been planning for.
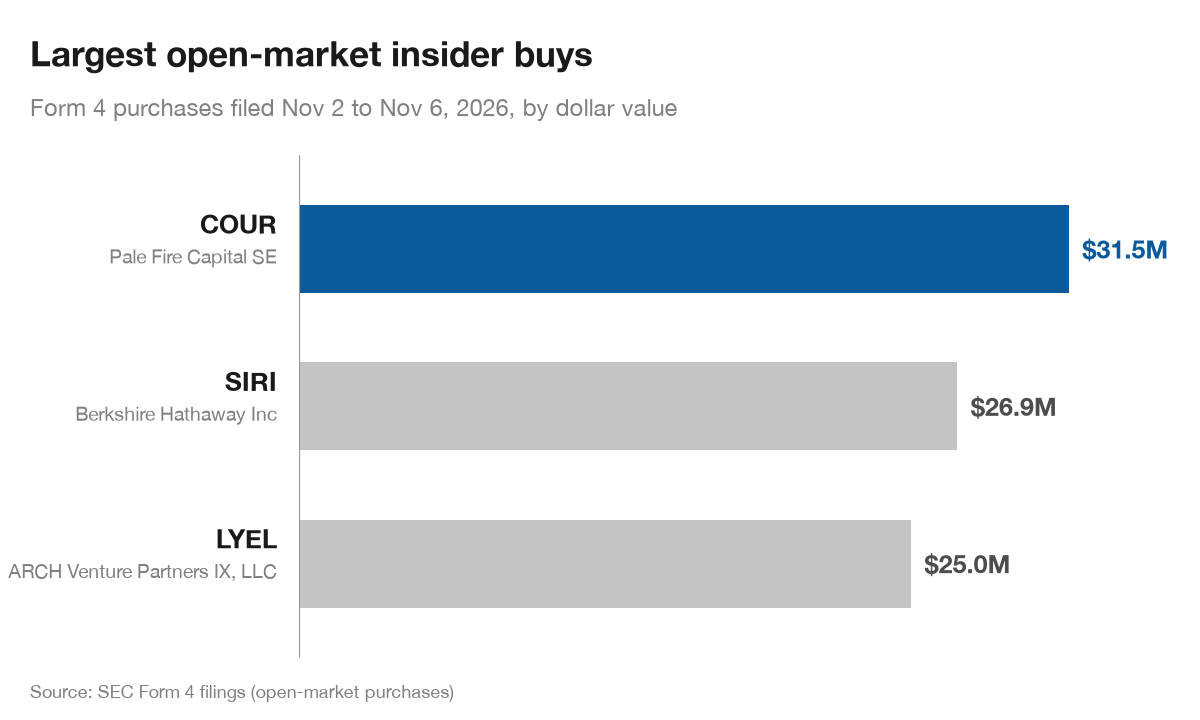
Insider buying. Three large open-market purchases showed up in Form 4 filings this week. Pale Fire Capital SE bought $31.5 million of COUR, filed Nov 5. BERKSHIRE HATHAWAY INC bought $26.9 million of SIRI, filed Nov 3, 2026. ARCH Venture Partners IX, LLC bought $25.0 million of LYEL, also filed Nov 5.
Our track record. Our analysis covers data from Oct 8, 2026 through Nov 3, and the samples are small. When stock sentiment sat in its top quarter of readings (6 cases), SPY was lower two days later in 5 of 6 cases and higher in 1 of 6. The average move was down 0.69%, against a typical two-day move of down 0.04% (p = 0.07; not statistically significant). Read it as context, not a trade signal.
Crypto
The week’s reading. Crypto sentiment averaged 17.5 this week, which is neutral. That is down 12.2 points from the prior week’s 29.7, which counted as bullish. Bitcoin’s daily close went from $77,198 on Oct 30 to $75,942 on Nov 5, down 1.6%. It traded at $75,943 intraday on Nov 6, per Yahoo Finance, after falling 4.8% the week before.
The reading never strayed far from the middle. It opened the week at its low of 14.1 on Nov 2. It peaked at 26.4 on Nov 4 and finished at 14.7.
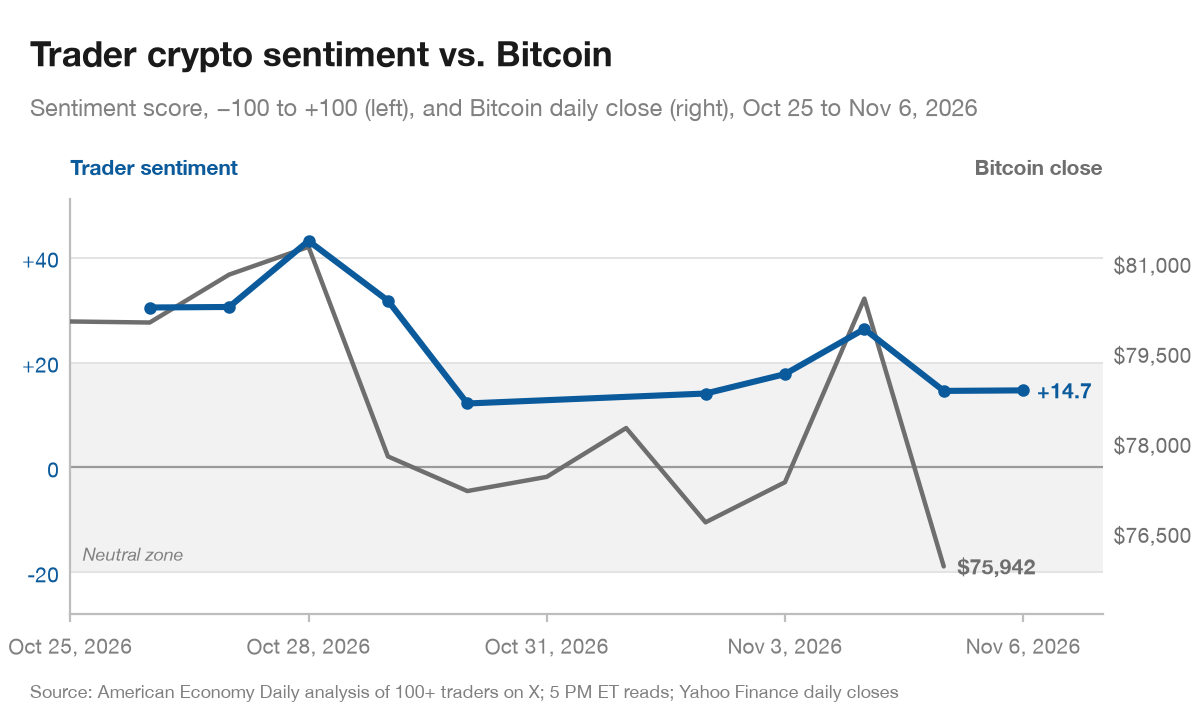
News vs. traders. The headline and trader figures above cover crypto too. Crypto mood fell further than stock mood, even though Bitcoin dropped less than the S&P 500.
Loudest bull and bear. On Nov 5, @0xbeehive argued that Bitcoin is forming a falling wedge after weeks of selling. The trader wrote that “the $75K support is STILL holding” despite repeated chances for bears to break it. They noted price was pressing into that zone again and liked the setup. Bitcoin’s daily close that day stayed above $75K, if not by a wide margin.
The same day, @rektcapital read the chart the other way. They said Bitcoin was retesting an old support level as new resistance for the third week running, after a weekly close slightly below ~$78300. They read repeated rejected upside wicks as evidence of renewed sell-side pressure and named ~$76800 as crucial support. Bitcoin’s Nov 5 close came in under it.
Our track record. When crypto sentiment sat in its top quarter of readings (8 cases), BTC-USD was lower two days later in 6 of 8 cases and higher in 2 of 8. The average move was down 1.01%, against a typical two-day move of down 0.90% (p = 0.87; not statistically significant). That makes it context, not a trade signal.
The gloomier days tell a slightly more interesting story. When crypto sentiment sat in its bottom quarter (9 cases), BTC-USD was higher the next day in 7 of 9 cases. The average move was up 0.49%, versus a typical one-day move of down 0.42% (p = 0.02; below 0.05, but one of many tests). One result among many can be luck, so treat it as context, not a trade signal.
Bottom line
Both markets fell and traders noticed, but neither reading left neutral for the week. The loudest voices argued over chart levels and a post-election rally that had not arrived by Friday. Call it mild unease with plenty of talk.
Sources
AED trader sentiment composite: 100+ traders on X, scored hourly; 5 PM ET readings Oct 26, 2026 to Nov 6, 2026. News fear/greed tagging of world, US, markets and geopolitics headline feeds.
SEC EDGAR Form 4: Pale Fire Capital SE (COUR), filed 2026-11-05
SEC EDGAR Form 4: BERKSHIRE HATHAWAY INC (SIRI), filed 2026-11-03
SEC EDGAR Form 4: ARCH Venture Partners IX, LLC (LYEL), filed 2026-11-05
Yahoo Finance: S&P 500 (^GSPC) and Bitcoin (BTC-USD) daily closes
AED analysis of sentiment vs. next-day and two-day SPY and Bitcoin moves, data Oct 8, 2026 to Nov 3, 2026
Thanks For Reading!
If you have any source you wish to see in our lineup, please reach out and let us know.
You can unsubscribe anytime from your subscription settings.