Gold's Unprecedented Climb
Exploring the Mystery: What's Really Behind Gold's Recent Surge to All-Time Highs?
Gold Surges
Gold has recently reached a new all-time high of $2,135 per ounce, which is significant considering the historical pattern of drawdowns following such highs. However, this time may be different. Over the past few decades, new all-time highs for gold have often signaled an imminent pullback followed by sideways movement for extended periods. Since the suspension of dollar convertibility into gold in 1971, gold has generally shown a consistent upward trend, with some exceptions.
After the all-time high in 1980, it took 28 years for gold to reach another one in nominal terms. In inflation-adjusted terms, gold has still not surpassed the 1980 peak. The key level to watch to determine if this gold move is significant is when it surpasses the 1980 high in inflation-adjusted terms, which is around $2,590 per ounce. If gold breaks above $2,600 per ounce in USD terms, it could indicate the beginning of a long-wave super-cycle for the yellow metal. During the global financial crisis, there were expectations that gold would soar as the financial system seemed to be imploding. However, gold experienced a significant decline along with other assets during the liquidity crisis. It eventually rebounded and went on a bull run until the 2011 high before experiencing a five-year decline.
The investment logic behind gold allocation is driven by the belief that if there is a potential crisis in the currency or financial system, people will buy gold as a safe haven. The bull thesis is traditionally based on three key elements: currency devaluation, fiscal deficits, and national debt. These have been out of control and accelerating for decades. A few newer theories have surfaced as well. These are the de-dollarization of the global economy, negative real yields leading investors to turn to gold instead.
Sponsored by
Learn the art & science of shipping more winning ads
The problem: your team isn’t shipping enough winning creative to scale ad accounts.
The solution: get your team to master the art and science of creative strategy with Thumbstop.
Every Sunday, you’ll learn how to bridge the gap between media buying and creative, helping you ship more winning TikTok, Facebook, and YouTube ads.
Help us keep going! Support our sponsors – they're the key to our publication's future. Please click the above to do so. Free to you and helps us greatly.
De-Dollarization
The idea of the end of USD as the global reserve currency was once considered a fringe belief. However, several events have changed this perception. The COVID pandemic led to stimulus measures that further exacerbated the issues of devaluation, deficits, and debt. Additionally, the weaponization of the financial system against foreign adversaries has prompted a reevaluation of holding USD foreign reserves.
De-dollarization is no longer an unthinkable scenario; it is now a reality. The BRICs (Brazil, Russia, India, China) are already planning an alternative system, and more transactions that were previously settled exclusively in USD are now being settled in alternative currencies, including gold. Although the current threat posed by the BRICs nations is relatively minimal, this situation highlights the desire of foreign entities to operate independently of the influence exerted by the US Dollar.
Real Yields
Real yields refer to the inflation-adjusted yields on bonds. As bond yields have dropped sharply recently, the benefit of regular bond payments compared to gold, which does not provide income, has decreased. This shift is a departure from previous years when rising real yields put pressure on gold prices.
Gold Price Pressures
The fall in the dollar, along with a drop in US Treasury yields, has led investors to believe that the Fed will lower borrowing costs in the near future. The prospect of interest rate cuts has been driving gold prices to record highs. Curiously, gold has been rising as inflation rates have been falling. Gold has experienced gains for seven out of the past eight weeks, resulting in an 11% increase for the year.
Another notable development is the increased buying of gold by central banks. In 2022, central banks purchased a total of 1,136 tons of gold, marking the highest level of net purchases since 1950. According to a recent survey by the World Gold Council, 24% of central banks plan to add more gold to their reserves in the next 12 months. Additionally, 71% of central banks surveyed believe that global reserves will increase in the next year.
In terms of gold ETFs, there has been a net outflow of 9 tons of gold globally. However, the rise in gold prices has led to a 2% increase in total assets under management. Currently, ETFs hold 3,236 tons of gold valued at $212 billion.
Investigating Gold Price Pressures
When examining the primary drivers of gold prices, one would expect to find clear correlations. We will look at the accepted drivers of gold price below.
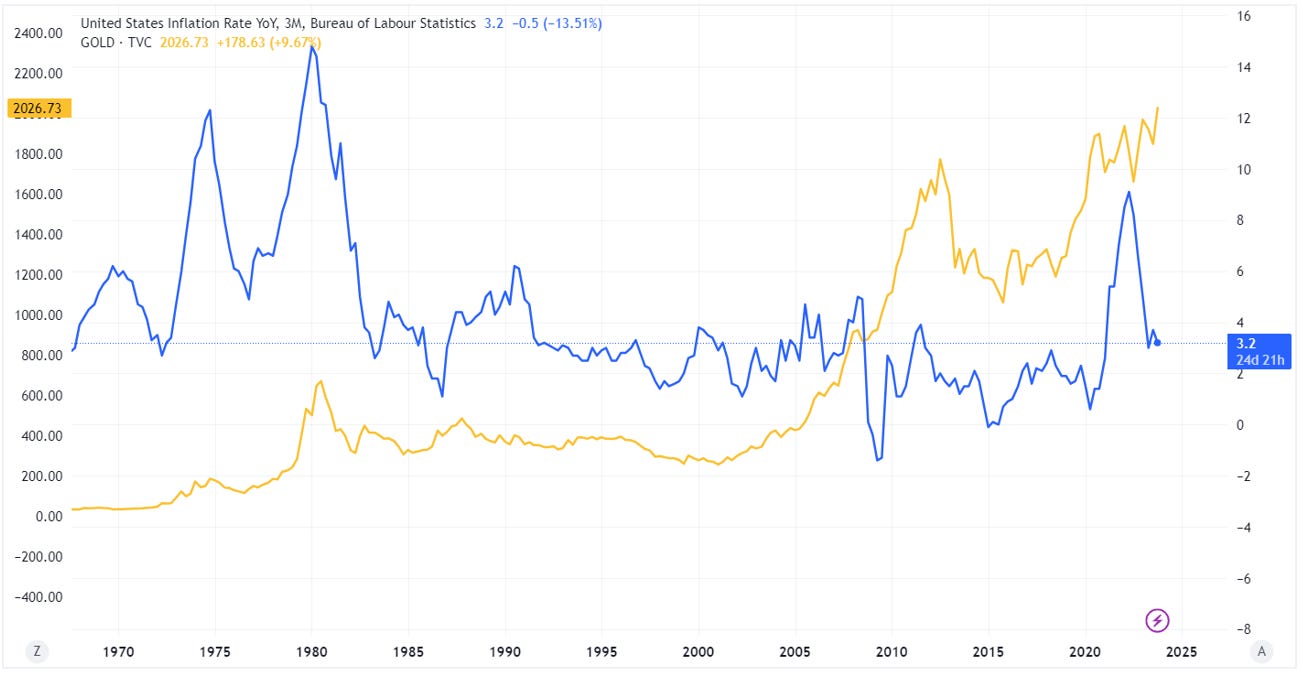
Gold vs Inflation
Commonly, one might anticipate gold prices to climb with rising inflation. However, a glance at the chart reveals a different story. While there are occasional spikes in gold prices coinciding with inflation peaks, the overall correlation appears weak.
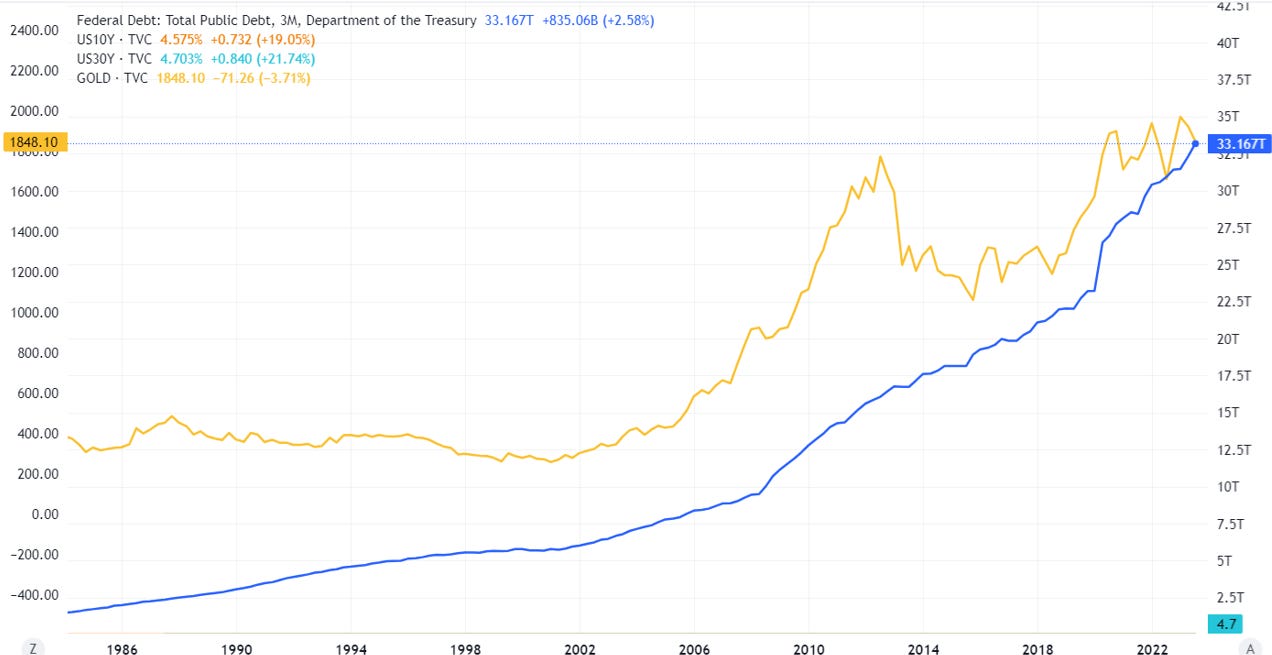
Gold vs US Debt
Conventionally, it's anticipated that gold prices would increase in tandem with rising debt levels. However, post the 2008 global financial crisis, this correlation seems to have shifted, with gold no longer consistently rising alongside increasing debt.
Gold vs USD Strength
Typically, a decrease in USD strength is expected to boost gold prices. While this correlation was evident in 2012, recent trends have shown an unusual pattern where gold prices have risen alongside a strengthening dollar, deviating from the expected inverse relationship.
Gold Vs Real Yields
Contrary to expectations, gold prices have risen even as real yields increased following recent Fed rate hikes. This unexpected trend suggests more complex factors at play than just yield movements.
Oil Prices
Since our last publication, seen here, oil prices have fallen even further to their lowest level in five months as investors doubt whether production cuts announced by OPEC+ will be enough to offset rising supply from non-OPEC countries and waning global demand. Despite Saudi Arabia and Russia leading the OPEC+ cartel in extending existing voluntary cuts and adding new reductions from other members, oil continually has dropped.
Thanks For Reading!
If you want to advertise your business to the 200,000+ readers of this newsletter, learn more here.
To Subscribe Click here.
To Read Past Newsletters Click here.
If you have any source you wish to see in our lineup, please reach out and let us know. We continually look to incorporate more independent sources to our weekly wrap-up.


